Connect an existing engine
Let a renderer keep its own commands and submissions. Declare its shared inputs and outputs as an external node, then combine it with work before and after that boundary.
 ZenFG
ZenFG
A composable FrameGraph for WebGPU and wgpu.
Build rendering features, compose GPU systems, and understand every frame.
YOUR FRAME, YOUR DESIGN
Keep control of scenes, materials, pipelines, and rendering policy. Give ZenFG explicit dependencies and resource accesses to coordinate the frame.
Let a renderer keep its own commands and submissions. Declare its shared inputs and outputs as an external node, then combine it with work before and after that boundary.
Use native WebGPU or compatible libraries to build domain-specific rendering and compute. Record nodes into the graph so their declared passes and resource flow can be inspected.
RUNNING EXAMPLES
Each example connects real GPU work to an inspectable frame graph. Open the result, follow its resources, and read the source.
GPU culling and indirect drawing, built without an engine dependency. A teaching renderer with an explicit Reset → Cull → Draw flow.
Open example ↗ SHARED COLOR + DEPTHThree.js and a custom renderer draw into shared color and depth attachments. Their objects occlude each other in one scene.
Open example ↗ EXTERNAL ENGINE · NETWORK REQUIREDCombine streaming Gaussian splats with custom drawing and compositing. Scene data loads from a remote host.
Open example ↗ COMPUTE + RENDERTypeGPU defines shaders and pipelines; ZenFG connects native compute and render nodes through persistent simulation resources.
Open example ↗Each example documents its dependency versions and integration details.
SNAPSHOT + INSPECTOR
Follow declared dependencies, resource lifetimes, and diagnostics. Inspect optional CPU/GPU timings alongside the structure that explains them.
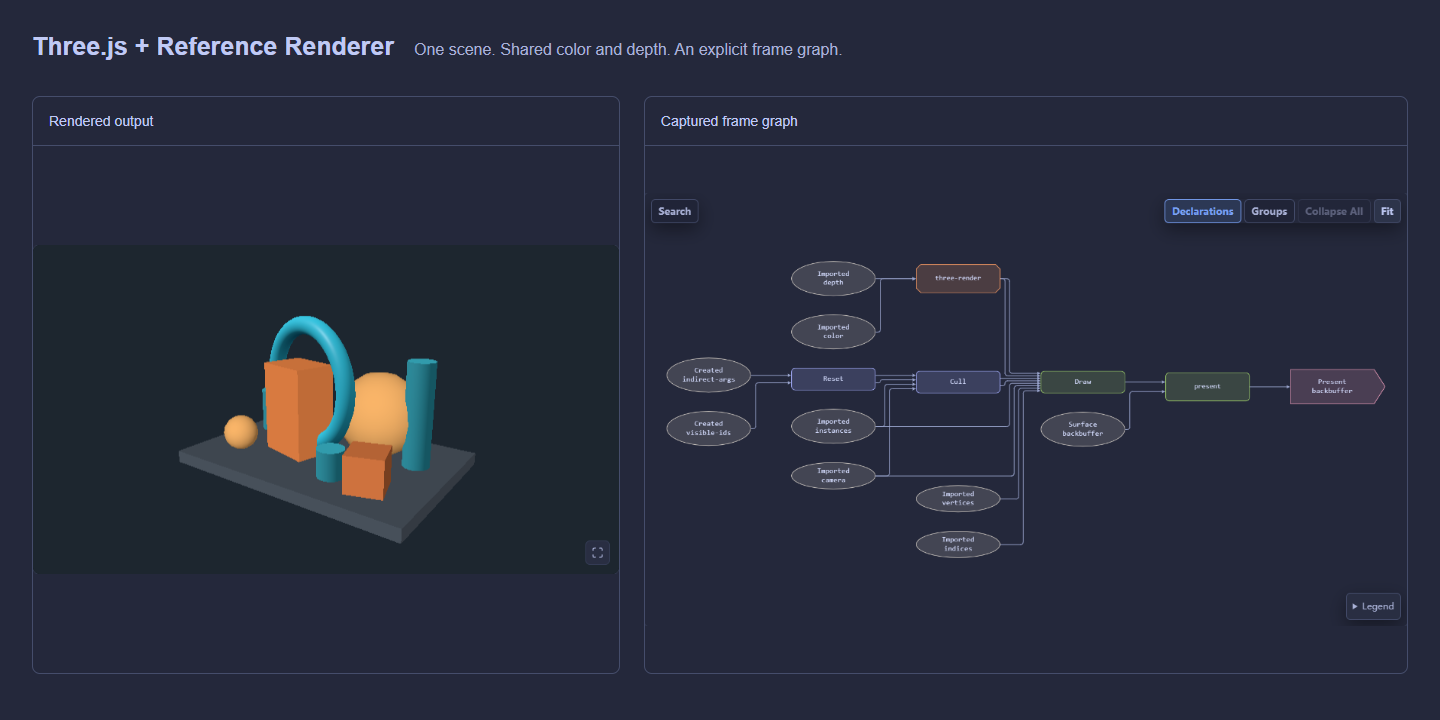
Capture an actual frame and locate the passes and resources that matter.
Export Snapshot JSON with relevant code for human or AI-assisted analysis. Use the Inspector to give precise feedback about the flow.
Capture again after changes. Check the resulting graph and available timings rather than assuming an optimization worked.
External-engine internals stay opaque. GPU timing depends on device support and node coverage. Snapshots describe declared work; they contain neither replayable GPU commands nor resource contents.
Read the Inspector workflow →One toolchain. Two ecosystems.
Idiomatic runtimes with shared semantics and portable diagnostics.
Manage resources. Catch issues early.
Track dependencies, manage lifetimes, and reuse transient resources.
Understand every frame.
Capture, navigate, and inspect your frame graph.